The Chart and the table
below show customer satisfaction levels in the US with airlines and aspects of
air travel in 1999, 2000 and 2007.
Summarize the information by
selecting and reporting the main features, and make comparisons where relevant.
 |
| Sample ielts Acadeimic Writing Task 1 |
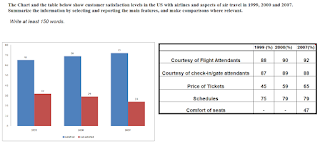
The given bar chart and table
illustrate changes in the satisfaction level of airlines passengers in terms of
various components in years 1999, 2000 and 2007.
The percentage of contended
passengers in the quoted period registered an uninterrupted rise from 65% in
1999 to 72% in 2007 though the rise was drastic between 1999 and 2000, from 65%
to 69%.
As far as various aspects of
air travel was concerned, there was a rise in percentage of travelers who were
happy with courtesy of flight attendants, touching 92% from 88% in
corresponding period, and ticket pricing, significantly rising from 45% to 65%.
Almost similarly, a great
percentage of people remained satisfied with the schedules of flights, rose
from 75 to 79.
A new component of air travel
was also surveyed about in 2007, seat comfort, and 42% felt happy with this
aspect.
However, in terms of services
of check-in gate staff, lesser satisfaction levels were registered in 2007 in
comparison to 2000, from 89 to 88%.
