Search This Blog

Sunday, May 24, 2020

Ielts Academic Writing Task 1 Graphs and Pie Charts The charts below show one government's spending on culture and education in 1995 and 2005

The charts below show one government's spending on culture and education in 1995 and 2005 and the number of people participating in arts events in the same years.
Summarize the information by selecting and reporting the main features, and make comparisons where relevant.
Write at least 150 words
The charts below show one government's spending on culture and education in 1995 and 2005
Ielts Academic Writing task 1


The given charts illustrate the percentage spent on culture and education by the government in the years 1995 and 2005, and depict the number of participants in the arts event held during the same time.
Overall, it can be observed that there are major changes in the allocation of budget in the 10 years, from 1995-2005, spending on music and visual arts experienced a significant decrease, whereas theatre and literature wittnesed a rise.

Majority of money was spent on music which had the highest number of participants i.e. 130,000 in 1995 followed by theatre, visual arts and literature having 80,000, 50,000 and 20,000 entrants respectively; whereas in 2005 the number of students registering rose in the above mentioned field by 25,000, 10,000, 5,000 and 10,000 respectively.

Moreover, monetary allocation to theater is made equal to what is being spent on musical activities in the same year and a similar trend can also be observed with visual arts whose funding is now equal to that of literature.

Wednesday, May 6, 2020

Ielts Academic Writing Task 1 Diagrams The diagram below shows how electricity is generated in a hydroelectric power station


The diagram below shows how electricity is generated in a hydroelectric power station.
Summarize the information by selecting and reporting the main features, and make comparisons where relevant.
Write at least 150 words
The diagram below shows how electricity is generated in a hydroelectric power station
Ielts Writing Task 1 Diagrams Dam

The given diagram elucidates functioning of a hydroelectric production unit.


Overall, the hydroelectric power production installation is largely divided into 4 primary parts, high level reservoir behind the dam, a channel to pump water to the turbine in the day and back to high level reservoir at night, a power station which has reversible turbines and a generator, and a low level reservoir. This unit produces electricity in the day.

The water stored in large reservoir behind the dam is channelized towards the low reservoir by opening the intake during the day. The water while flowing towards low reservoir runs the reversible turbines, housed at the base of power station, which in turn operate generator, producing electricity. The electricity is supplied to the grid with the  help of power lines. This operation takes place in the day.

In the night, the electricity generation is halted and water from the low reservoir is pumped back into the high reservoir with the turbines operating in reverse direction.


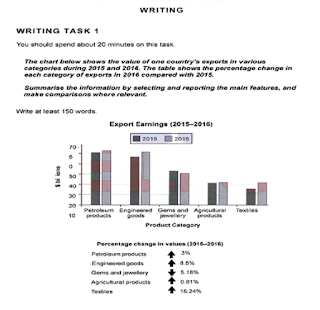
Ielts Academic Writing Task 1 The chart below shows the value of one country's exports in various categories during 2015 and 2016


The chart below shows the value of one country's exports in various categories during 2015 and 2016. The table shows the percentage change in each category of exports in 2016 compared to 2015.
Summarize the information by selecting and reporting the main features and make comparisons where relevant.
Write at least 150 words
 
The chart below shows the value of one country's exports in various categories during 2015 and 2016
Ielts Academic Writing task 1 - Graphs and table 
The graph and table elucidate alterations in exports and value of 5 categories of goods in a country in two years, 2015 and 2016
Overall, patterns of changes in exports and value of supplied categories correspond to each other, where textiles witnessed an exponential jump in exports and value, gems and jewellery saw a decline. 
In case of exports, biggest jump was seen in textiles, rising from approximately $35 to $40 billion, this was followed by engineering goods from nearly 63 to almost 70 billions, petroleum products from 70 to 72 billions approximately, and agri-products from 38 to 40 billions. However, the exports of gems and jewellery saw a downfall from almost 52 to almost 50 billions.   
Similarly, when assessing the changes in the value, an identical pattern can be observed where the highest value addition took place in textiles, 15.24%, followed by engineering, petroleum, agriculture which saw addition of 8%, 3% and 5.18% respectively. In contrast, gem and jewellery registered a fall of .81%