
The Graph below shows the number of shops that closed and the number of new shops that opened in one country between 2011-2018.
Summarize the Infomation by selecting and reporting the main features, and make comparisions where relevant.
Write at least150 words.
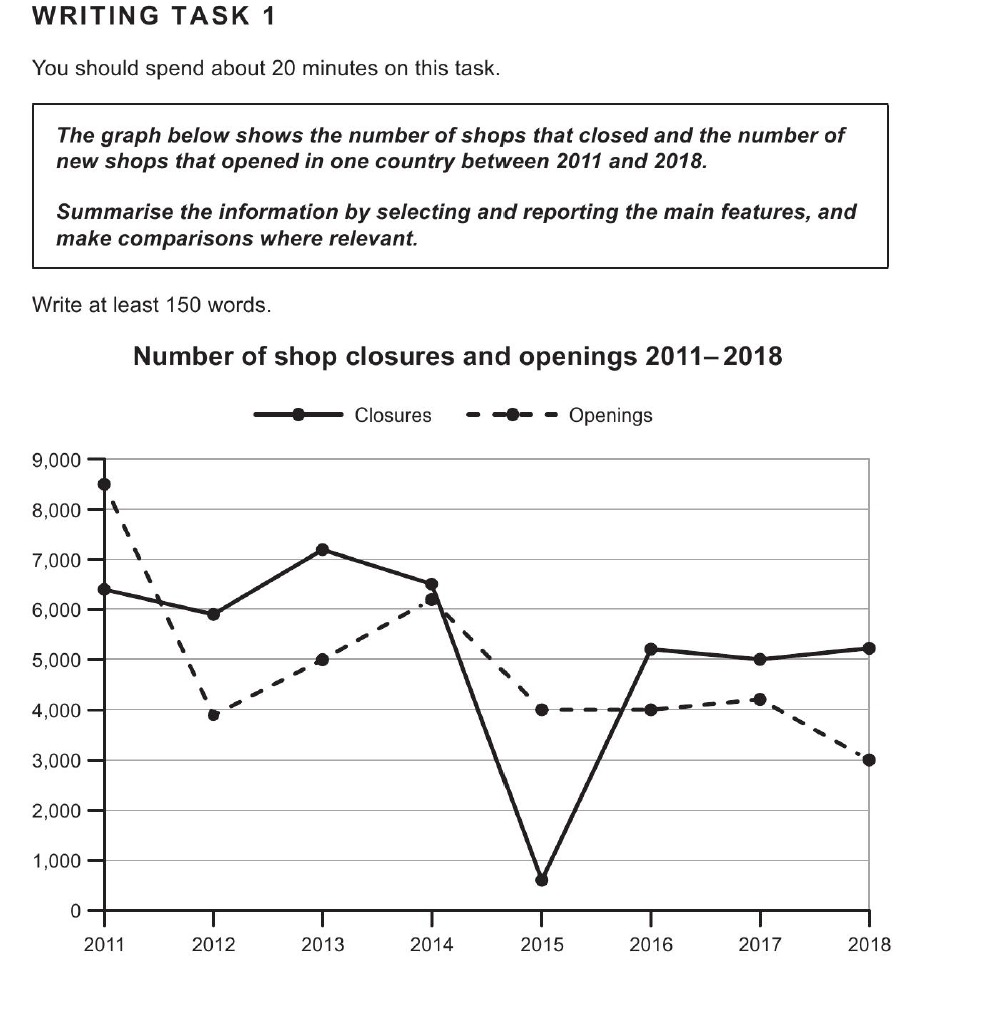
The given line graph elucidates and compares the patterns of opening and closure of shops in a country between 2011 and 2018.
In general, in 2011, approximately 8500 new outlets were established, but over the next year up to 2012 numbers slid down sharply to under 400. From 2012-2014 there was an increment of more than 2000 shops being opened, the number reaching to over 6000. Moving further, there was a decline over the next four years; fewer stores were opened with the figures plummeting to 3000 by 2018, even though there was a stability for two years between 2015 and 2017 when both years saw yearly 4000 shops starting each year.
In continuation, although the number of stores shutting down experienced similar patterns, they overtook the figures of new openings. In 2011, almost 6200 shops closed, and between 2011 and 2014 there was an ascent to 6400 following fluctuations. From 2014-2015 there was a notable dip to almost 700, but by 2018 it climbed back to over 5000.