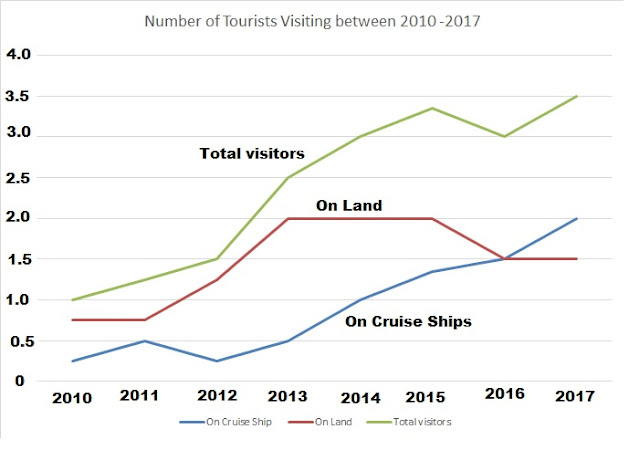
The graph below shows the number of tourists visiting a particular Caribbean island between 2010 and 2017. Summarize the information by selecting and reporting the main features, and make comparisons where relevant.
The graph elucidates the number of tourists visiting a Caribbean Island between the period of 2010 and 2017.
Overall, the visitors staying on cruise ships and the total number of visitors experienced similar trends. The former increased upto 2011, however, declined in 2012; they further increased up till 2017. Similarly, the total numbers of visitors rose upto 2015; the trend remained constant till 2016 and spiked in 2017.
In 2010, the visitors on ships rose to 0.5 million, but fell to approximately 0.25 in 2012. They then experienced an upward trend till 2017 to 2 million. However, the visitors staying on the island remained constant till 2011 at almost 0.75; the number of visitors increased upto 2013 to 2.0, but remained unchanged till 2015, and decreased up to 2016 to nearly 1.5 million. However, it slightly increased to 1.5 up to 2017.
The total visitors went up over 3.0 million up to 2015; thereafter, after a dip till 2016, it witnessed a surge to 3.5.

