Search This Blog

Monday, July 23, 2018

Ielts Academic Writing Task 1 Ielts Graphs


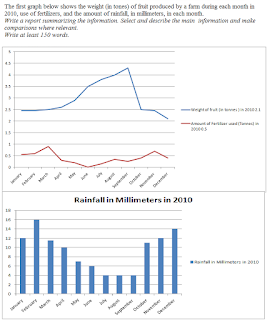
The first graph below shows the weight (in tones) of fruit produced by a farm during each month in 2010, use of fertilizers, and the amount of rainfall, in millimeters, in each month.

Write a report summarizing the information. Select and describe the main  information and make comparisons where relevant.
Write at least 150 words.

 
The first graph below shows the weight (in tones) of fruit produced by a farm during each month in 2010, use of fertilizers
Ielts Academic Writing Task 1 Graphs 
The given graphs compare fruit produced, fertilizers used and amount of rainfall, in a farm in 2010

Overall, trends of yield of fruits are inversely proportional to use of fertilizers and amount of rainfall – yield of fruit was high when use of fertilizers and rainfall was low.

In January, the harvest of fruit was 2.5 tone and stayed stable till April. After this, the yield rose dramatically and touched a peak of  almost 4.5 tonnes in September. From there on the yield declined to levels of January though the decline was more remarkable in the month of October.

While, the use of fertilizers rose from .5 tonnes to almost 1 tonne and declined to nearly zero in June , but from July to   November it rose, touching the peak in November, 0.7 tonnes and declining again. The rainfall seems to coincide with the fertilizer, falling from a high of 16 mm in January to 4mm in July and then rising to 14 mm in December.   


Tuesday, July 17, 2018

Ielts Academic Writing Task 1 The graphs below show the types of music albums purchased by different groups of people in Britain according to sex and age.


The graphs below show the types of music albums purchased by different groups of people in Britain according to sex and age.
Write a report for a university professor by describing the information shown below.
Write at least 150 words.   
The graphs below show the types of music albums purchased by different groups of people
Ielts Academic Writing Task 1 


The given bar graph elucidates the preferences of men and women and different age groups in terms of genre of music.

Overall, it can be observed that more men than women buy all kinds of music, and younger age groups  prefer pop and rock, while people aged over 45 years like classical music.

As far as, the gender based preferences us concerned, both males and  females, over 20% and 15% respectively, prefer pop and rock over classical, under 10% in both the sexes.

Age-wise preferences of music genre show that in case of pop and rock, buying preferences are almost identical: people aged between 25-34 years are dominating customers, 30% buying both pop and rock, followed by individuals between 16-24 years, 15%, and older than 45 years, less than 10%.
On the other hand, classical music is most preferred by people aged over 45 years, approximately 20%. Negligible numbers in other age groups prefer this type – though 15% people between 25 and 34 years buy this type too.