The Graphs below
provide information on global population figures and figures for urban
populations in different world regions.
Summarize the information by selection and
reporting the main features, and make comparisons where relevant.
Write at least 150 words
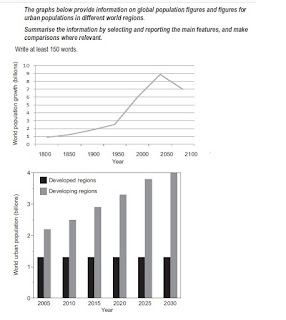
The given line chart and bar graphs elucidate the rise in
global population between 1800- 2000 and projections till 2100, and changes in
urban population in developed and developing regions from 2000 to 2030
respectively.
Overall, the world population is expected to grow
phenomenally till 2050, but decline in next five decades. urban population in
developing regions would consistently rise till 2030 while in developed regions
it would stay constant.
The population of the world rose negligibly approximately
from 1 billion to nearly 2.5 billion from 1800 to 1950. However, it rose two
folds in the later half of the twentieth century, and is expected to continue
rising till 2050 and touch almost 9 billion though the next half of the twenty
first century a decline is expected with the population falling to 7billion.
Moving further, the urbanized population in developed
regions is expected to stay constant at 1.25 billion till 2030. Whereas, in
developing regions a constant rise is expected from 2.25 billion in 2005 to 4
billion in 2030.

