The pie-charts below show the percentage of water used for different
purposes in sis areas of the world.
Summarize the information by selecting and reporting the main features,
and make comparisons where relevant.
Write at least 150 words
 |
| Ielts Academic Writing Task 1 Water Usage |
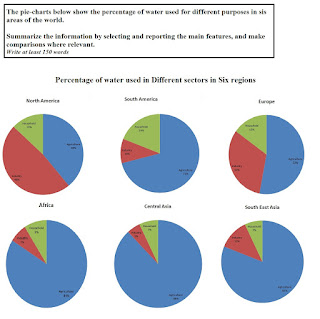
The given pie-charts compare the use of water in three
sectors: primary, secondary and domestic, in six regions of the world
Overall, in most of the regions: Central Asia, South East
Asia, Africa and South America, agriculture happens to be the major user of
water, but in case of Europe and North America, demand for water is more in
industry.
Most of the quoted regions had identical water utilization
patterns, Central Asia, South East Asia, Africa and South America, water was used
in huge quantity in primary sector, 88%, 84%, 81, 71% respectively. In these
regions, except South East Asia – where manufacturing followed the agriculture
12% and eventually domestic 7%, domestic
sector was a distant second7%, 9% and 19% respectively, with the secondary
sector using the least, 5% 7% and 10% respectively.
However, in Europe and North America demand in secondary
sector was highest, 53% and 48%. In these
regions, agriculture was the second biggest consumer, 32% and 39%, while domestic sector used least, 15%
and 13% respectively.
