The Graph and the bar chart below show the average monthly
rainfall and temperature for one region of East Africa.
Summarize the information by selecting and reporting the main
features, and making comparisons where relevant
Writ at least 150 words
 |
| Ielts Academic Writing task 1 - The Graph and the bar chart below show the average monthly rainfall and temerature for one region of East Africa. |
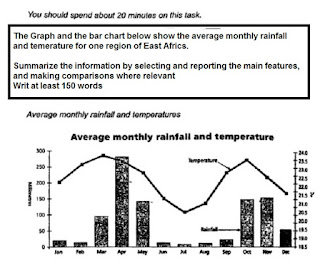
The graph elucidates weather patterns in an East African region
during a year.
Quite strikingly, it can be observed that patterns of
rainfall and temperatures are almost identical. Even though variation in the rainfall
is much greater than the temperatures all around the year, there are marked
similarities in the rise and fall of both.
Where the variation in the rainfall varies from 10mm - January
to 270 mm in April, the temperature varies from 20.5 degrees to 23.5 degrees,
but it can be seen that rise in rainfall amount generally coincides with simultaneous rise in the temperature - it
rains when it is hot.
Similarly, as the precipitation hits lowest between June and
August - below 10 mm with 2 mm in July, weather
also cools down in the corresponding period - 20.5 degrees in July.
Although both rise in later part of the year, the weather
becomes hotter, rises back to 23.5 degrees, the rainfall registers much lesser rise,
up to 150 mm.
