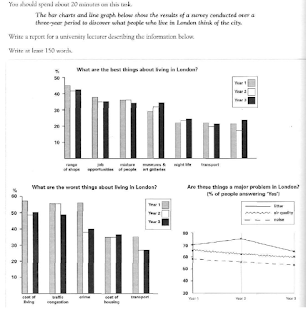
The
bar chart and line graph below show the results of a survey conducted over a
three-year period to discover what people who live in London think of the city.
Write
a report for a university lecturer dscribing the information below.
Write
at least 150 words
 |
| Ielts Essay - The bar chart and line graph below show the results of a survey conducted over a three-year period to discover what people who live in London think of the city |
The given graphs elucidate opinions about the best and the
worst things that affected the quality of life in London over a three year
period.
It can be clearly observed that variety of shops was to the
most popular among Londoners followed by employment openings, ethnic mix,
museums and galleries, and transport even though the positive opinions about shopping options, employment openings and racial mix witnessed a slight
decline; and views about museums and galleries, night life and transportation registered a slight
improvement.
But, cost of living, traffic jams and crime were considered
to be the weakest points for this city followed by prices of accommodation
and transportation. There was a great
improvement about criminal activities, living costs, jams, and transport, while
accommodation costs became an eye sore.
People's views about major issues faced in the city: littering,
air pollution, noise, also improved despite littering registering a slight rise
in the second year.
Quite strikingly, transport was a strong, as well as a weak
point of life of London.
