The chart
below gives information about Southland’s main exports in 2000, 2022 and future
projections for 2025.
Summarize the information by selecting and reporting the main features, and make comparisons where relevant
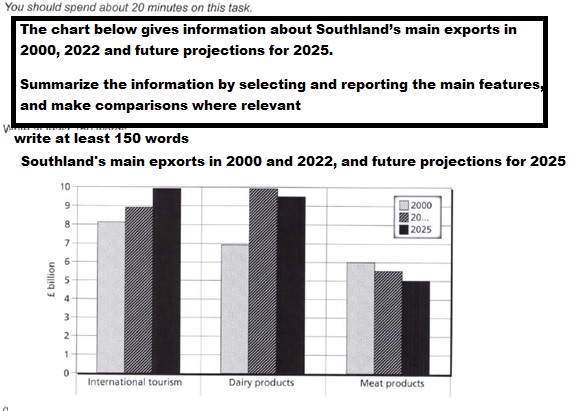
The given bar graph elucidates and compares changes in exports of three items from Scotland from 2000-2022 and presents forecasts for 2025. The quantum of exports is calibrated in billion pounds.
To start with, in 2000, international tourism helped gross just over 8 billion pounds, while dairy products fetched 7 billion pounds. The exports of meat products stood at 6 billion pounds.
From 2000 to 2020, there was an increment in the earnings of international tourism from 8 to almost 9 billion pounds, and even though dairy products also registered a rise, it was quite steep as it climbed to nearly 10 billion pounds. In contrast, meat products witnessed a fall from 6 to about 5.5 billion pounds.
Moving further, the predictions for 2025 show that international tourism would continue to ascend and reach approximately 10 billion pounds, whereas dairy products are expected to plummet to near about 9.5 billion pounds. Meat products will continue to slide down further to 5 billion pounds.

