Search This Blog

Tuesday, October 30, 2018

Ielts Academic Writing task 1 Pie Chart Population Comparison in Yemen and Italy


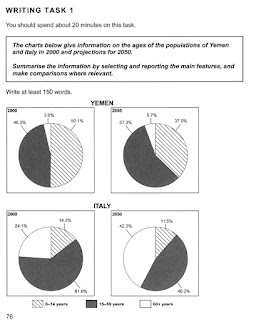
The Charts below give information on the ages of the populations of Yemen and Italy in 2000 and 2050.
Summarize the information by selecting and reporting the main features, and make comparisons where relevant.
Write at least 150 words

 
The Charts below give information on the ages of the populations of Yemen and Italy in 2000 and 2050
Ielts Academic Writing task 1 Population Changes 
The given charts elucidate changes in demographic composition, in terms of age, in Italy and Yemen between 2000 and 2050.

On an overall, both countries will experience similar trends – population of old people would rise though more steeply in Italy, while ratio of the youngest would decrease. However, where in Yemen proportion of people aged between 15-59 years would rise, it would decline in Italy.

In Yemen, in 2000, most of the population was aged between 0-14 years, 50.1%, it was followed by age group 15-59, 46.3%, and 60+ years, 3.6%. By 2050, where the ratio of people in age group 15-59 would swell to 57.%, and that of very old would rise to 5.7%, the number of the youngest would shrink to 37%.

But, Italy which had 61.6% people in 15-59 age group, followed by 60+, 24.1% and 0-14, 14.3%,  in 2000, may experience a contrasting trend. The ratio of people over 60 would be 42.3%, whereas, the population of 0-14 and 15-59 would fall to 11.5 and 46.2% respectively. 


Friday, October 5, 2018

Ielts Academic Writing Task 1 Diagram Horse evolution


The diagrams below show the development of the horse over a period of 40 million years. Summarize the information by selecting and reporting the main features, and make comparisons where relevant.

The diagrams below show the development of the horse over a period of 40 million years
Ielts Academic Writing Task 1 Diagram

The given diagrams elucidate the evolution process of modern horse – from Eohippus to the horse we see today.
On an overall, the development of modern horse took forty million years and four stages. The first diagram depicts eohippus that appeared forty million years ago, it was smaller in size, and had four fingers foot. In the next ten million years, eohippus transformed into Mesohippus, which was slightly bigger than its predecessor; had short hair on the  back of its neck. The noticeable change occurred was in its foot structure where four fingers were replaced by three, and the middle finger had a bulb.

The Merychippus appeared 15 million ago, which was again bigger and had thicker hair and tail, with a larger foot, the structure of toes also expanded in size.

The species of modern horse is the largest, with a thick coat of hair and a tail. The anatomy of foot has witnessed drastic changes, as toes have given way to a hoof, a complex foot structure.


The final stage in the evolution of the horse is that of a modern horse. This species is largest in its lineage, which has a thick  coat of hair on the back of its neck and a thick and long tail.