Search This Blog

Wednesday, April 28, 2021

Ielts Academic Writing Task 1 Diagrams The diagram below shows how electricity is generated in a hydroelectric power station


The diagram below shows how electricity is generated in a hydroelectric power station.

Summarize the information by selecting and reporting the main features, and make comparisons where relevant.

Write at least 150 words 


The given diagram describes the process of electricity production in a dam with reversible turbines. 

Overall, such an electricity generation facility requires a dam with two reservoirs, upper and lower, a tunnel to channelize water, a reversible turbine, and a generator. This installation generates electricity during the day. 

During the day, water from the high-level reservoir behind the dam, which is sent to the low-level reservoir with the help of the tunnel by opening the intake. The water, while flowing towards the lower reservoir passes through the power station, driving reversible turbines in the process. The turbines in turn drive the generator which produces electricity. The electricity generated is supplied to the national grid with help of power cables.  

During the night, the intake is closed in the high-level reservoir, and water is pumped back to the this reservoir from the low-level using reversible turbines, which start working backwards, and  with the help of the water tunnel, pump back the water to the high-level reservoir. 

Wednesday, April 21, 2021

Ielts Academic Writing Task 1 The pie charts below show exports from various EU countries to India and China


The pie charts below show exports from various EU countries to India and China in 2005 and 2015.

Summarize the information by selecting and reporting the main features, and make comparisons where relevant. 

The pie charts below show exports from various EU countries to India and China in 2005 and 2015


The given pie-charts elucidate and compare changes in the patterns of exports from EU to India and China between 2005-2015.

Overall, in case of India there was a major shift in the given decade where Germany became the major source to india by replacing the UK, while in case of China, Germany was already exporting more goods to this country, and consolidated this position in the following decade, by accounting for nearly half of this exports. 

In 2005, most of the goods to India from the EU were exported by the UK (29%); this was followed by Belgium (25%) and Germany   (15%). The rest of  other countries had exports under 10%. But between 2005-2015 the composition of exports changed dramatically, Germany accounting for 25% followed by Belgium (20%) a fall of 5% while the UK witnessed more than twofold to 13%.

However, in China in 2005 most imports from the EU were from  Germany (38%) and France (13%). Over the next decade the share of Germany rose to 48%.  

Wednesday, March 17, 2021

Ielts Academic Writing Task 1 The charts below compare five different countries


The charts below compare five different countries, showing the electricity used (measured in megawatts or mw) in a typical hospital during one week, and  also the number of emergency calls made by local residents during the same week. The last charts shows the average time (in minutes) spent on assessing emergency cases by hospitals medical staff before the patients are treated.

Write a report summarizing the information. Select and describe the main features, and make comparisons where relevant.

Write at least 150 words


The charts below compare five different countries


The given tables and graph elucidate the consumption of electricity(in megawatts), calls made by locals and average time taken to assess medical emergency cases by hospitals in 5 countries in a week. 

Overall, the patterns in terms of energy consumption, and number of emergency medical calls show identical patterns in different countries, except the average time taken to pre-assess emergency cases. 

In terms of energy consumption and calls,  France and Japan depict similar trends with limited fluctuations, between 12-14 and 15-16, and 100-120 and 80-90 respectively, while  in Canada and Russia, both energy tend to rise, from 26-38 and 12-24, and over 100 - over 160 and 60-110 respectively, whereas, Argentina experiences lowest incidence in both which also declines from 9 to 5 towards weekend.   

However, when it comes to the average time spent to assess emergencies before treatment, France, Canada, Japan do not witness much change, ranging between 11-16 minutes; in Argentina it stays constant at 12 minutes, but Russia experiences a rise from 12-28 minutes over the week.  


Sunday, February 7, 2021

Ielts Academic Writing Task 1 Graph The table below shows the figures for imprisonment the five countries between 1930 and 1980


The table below shows the figures for imprisonment the five countries between 1930 and 1980.

Write a report for a university professor, lecturer describing the information shown below

Write at least 150 words


The given bar chart elucidates the trends of imprisonments in five countries, between 1930-1980. 

Overall, while the number of prisoners in the UK rose consistently in five decades, the other four countries witnessed fluctuation in numbers. Similarly, while Canada had the highest number of prisoners in 1930, the US surpassed all other nations in the given period, and had the highest number of convicts in 1980. 

The number of prison sentences in the UK rose consistently from approximately 30,000 to over 80,000 from 1930-80. In contrast, Canada had 120000 prisoners in 1930, it fell upto 1980 touching nearly 90,000, but not without fluctuations. New Zealand and Australia saw similar trends, plummeting from 100 and 70 in 1930 respectively to approximately 45 and 42 in 1950 saw a rise to over 80 while the latter fell further to 50. The number of respectively, rising back to over 60 in 1970. In the next decade, the former convicts in the US touched almost 140. 

Friday, February 5, 2021

Ielts Academic Writing Task 1 Diagrams The diagrams below show the life cycle of a species of large fish called the salmon

The diagrams below show the life cycle of a species of large fish called the salmon.

Summarize the information by selecting and reporting the main features, and make comparisons where relevant.

 Write at least 150 words 

The diagrams below show the life cycle of a species of large fish called the salmon


The given diagram elucidates different phases in the life cycle of salmon along with the time spent in each phase, from hatching from the eggs to laying eggs.


Overall, this fish experiences three stages over roughly nine and a half years, in which it travels from the point of its origin to the seas and back, and passes through distinct stages and grows in size.


The life cycle of salmon starts when adult fish spawn in the slow moving waters of the upper river, under the reeds and in stones. These eggs hatch into small fish, fry, measuring between 3-8cm. It stays in these waters for 5 to 6 months. After this, as it grows bigger and attains the size between 12-15cm, at this stage it is termed as smolts, it moves to the lower river with slow moving waters and spends 4 years. Further, it moves into open seas for 5 years where it becomes an adult measuring 70-76cm. The adult fish swims back to upper river for spawning.


Saturday, January 16, 2021

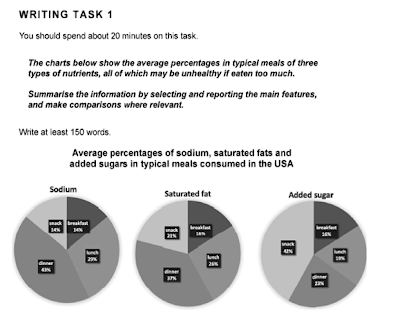
Ielts Academic Writing Task 1 Pie Charts The charts below show the average percentages in typical meals of three meals of nutrients


The charts below show the average percentages in typical meals of three meals of nutrients, all which may be unhealthy if eaten too much.

Summarize the information by selecting and reporting the main features, and make comparisons where relevant.

Write at least 150 words  


 The charts below show the average percentages in typical meals of three meals of nutrients


The given pie charts illustrate per person average consumption of three nutrients, which can be harmful if consumed in excess, namely, sodium saturated fat and added sugar, in the USA . 

Overall, the average intake of sodium and saturated fats is highest, quite similar in patterns, in dinner while that of added sugar is in snacks. However, interestingly, these nutrients are consumed least in breakfast.   

The people of the USA consume most of Sodium and saturated fat in dinner, 43% and 37% respectively, this is followed by intake during lunch, 29% and 26% respectively, and snacks, 14% and 21% respectively. The consumption of this element in breakfast is similar to snacks in case of the former while it is 16% in case of the latter.

In contrast, the consumption pattern of added sugars is highest with snacks, 42%, which is followed by dinner, 23% and lunch, 19%. Quite strikingly, the intake of this element is the lowest when  people have breakfast, 16%.  


Wednesday, December 30, 2020

Ielts Academic Writing Task 1 The diagram below shows how a mechanical arm works


The diagram below shows how a mechanical arm works, and how the joints that make up the arm function in the same way as those in a human arm. Summarize the information by selecting and reporting the main features, and make comparisons where relevant


The diagram below shows how a mechanical arm works

The given diagram elucidates how a robotic arm works in a similar fashion to a human arm while performing tasks such as spray painting, drilling and welding. 


Overall, a mechanical arm is controlled by three computer monitored  motors and has joints similar to a human arm.  

 This arm is anchored to the foundation at the shoulder. This base is usually not moving, but sometimes it is movable. The movement of raising or lowering the arm is supported by the pivot installed between the shoulder and the base. This part also allows rotation of the whole arm, allowing it to work just like a human shoulder. 

The elbow in the middle allows free movement including flexing and rotating, affording complete flexibility to the whole equipment. Similarly,   the wrist of the mechanical arm functions just like a human counterpart allowing hand free movement, gripper  in this case. Gripper is equipped  with sensors to control force of hold. Gripper can be replaced by other end-effectors:  spray paint, drilling and welding metals.