Search This Blog

Wednesday, December 30, 2020

Ielts Academic Writing Task 1 The diagram below shows how a mechanical arm works


The diagram below shows how a mechanical arm works, and how the joints that make up the arm function in the same way as those in a human arm. Summarize the information by selecting and reporting the main features, and make comparisons where relevant


The diagram below shows how a mechanical arm works

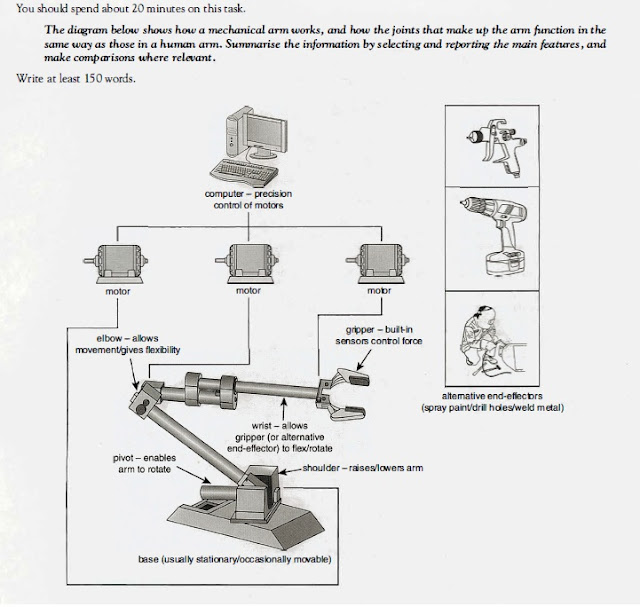
The given diagram elucidates how a robotic arm works in a similar fashion to a human arm while performing tasks such as spray painting, drilling and welding. 


Overall, a mechanical arm is controlled by three computer monitored  motors and has joints similar to a human arm.  

 This arm is anchored to the foundation at the shoulder. This base is usually not moving, but sometimes it is movable. The movement of raising or lowering the arm is supported by the pivot installed between the shoulder and the base. This part also allows rotation of the whole arm, allowing it to work just like a human shoulder. 

The elbow in the middle allows free movement including flexing and rotating, affording complete flexibility to the whole equipment. Similarly,   the wrist of the mechanical arm functions just like a human counterpart allowing hand free movement, gripper  in this case. Gripper is equipped  with sensors to control force of hold. Gripper can be replaced by other end-effectors:  spray paint, drilling and welding metals.  


Wednesday, December 23, 2020

Ielts Academic Writing Task 1 Graphs The chart below shows information about changes in average house prices in five different cities


The chart below shows information about changes in average house prices in five different cities between 1990 and 2002 compared with average house prices in 1989.

Summarize the information by selecting and reporting the main features, and  make comparison where relevant.

Write at least 150 words

The chart below shows information about changes in average house prices in five different cities between 1990 and 2002 compared with average house prices in 1989


The given bar chart illustrates changes in the average prices of dwelling units between 1990 and 2002 based on the average prices of 1989.

Overall, the average mean prices of housing registered to the large fluctuations in London and New York while in Madrid, Tokyo and Frankfurt they remained largely in the same pattern.

In the period from 1990 to 1995 the prices of residential units in London and Tokyo registered the steepest fall of approximately -7%. This was followed by New York, -5%  in comparison to 1989 prices. However, Frankfurt and Madrid recorded a rise of nearly 3% and 2% respectively. 

Quite interestingly, in the period of 1996-2002 radical variations were witnessed in the case of London and New York where a dramatic rise of almost 11% and 5% respectively, was registered in relation to 1989. In contrast, in Tokyo the prices were 5% lesser in comparison to 1989 while Madrid and Frankfurt had almost 4% and 2% higher prices than the base year. 


Friday, December 18, 2020

Ielts Academic Writing Test Bar Graph The bar chart below shows the percentage of Australian men and women in different age groups who did regular physical activity in 2010


The bar chart below shows the percentage of Australian men and  women in different age groups who did regular physical activity in 2010.

Summarize the information by selecting and reporting the main features, and make comparisons where relevant.  

The bar chart below shows the percentage of Australian men and  women in different age groups who did regular physical activity in 2010


The given bar chart illustrates the participation of Australian men and women in regular physical regimes in different age groups, in 2010. 


Overall, age-wise patterns of both the genders were inversely proportional to each other, where lesser men undertook such activities as the age rose to a certain point, participation of women rose, but in 65 and over, both the genders had equal engagement. Similarly, the highest participation in males was in the youngest age group while among women it was at the peak in the oldest.


The highest participation among men was age group 15 to 24, 52.8%, but it plummeted  to 39.5% in 35 - 44 group though the fall was steeper upto 25-34, reaching 42.2%. After that the participation rose steadily to 46.7% in the oldest group. 


However, the participation among women peaked at 53.3% in the 45 - 54 age group after rising from 47.7%, the lowest, among the youngest group, it dropped to 47.1% in the oldest group.


Thursday, December 17, 2020

Ielts Academic Writing task 1 Pie Charts The charts below show the average annual spending for Canadian households in the year 1972 and the year 2002


The charts below show the average annual spending for Canadian households in the year 1972 and the year 2002.

Summarize the information by selecting and reporting the main features, and  make comparisons where necessary.


The charts below show the average annual spending for Canadian households in the year 1972 and the year 2002


The pie charts elucidate changes in spending patterns of Canadians in terms of various consumer items in a matter of 3 decades from 1972 to 2002.

Overall, where a lesser amount was allocated to food and books, more was spent on cars, restaurants and computers, while that petrol and furniture registered a minor decline.  

In 1972, the highest ratio of household budget went into food, 39% and  cars, 22%. This was followed by spendings on furniture and petrol, 11% and 10% respectively, and books and computers, 7% and 3% respectively.

Between 1972 and 2002, a dramatic shift was observed in budget allocation, where the ratio of food a decline almost three folds to 14%, that of restaurants witnessed a two fold increment to 14%. Canadians spent most on cars,  40% though petrol witnessed a minor decline to 9%. Books also saw a decline to 3% with spendings on computers rising to 11%. Similarly, furniture also saw a minor decline of 2% to 9%. 

Friday, December 4, 2020

Ielts Academic Writing Task 1 The pie charts below show units of electricity production by fuel source in Australia and France in 1980 and 2000.

The pie charts below show units of electricity production by fuel source in Australia and France in 1980 and 2000.

Summarize the information by selecting and reporting the main features, and make comparisons where relevant.

Write at least 150 words  


The pie charts below show units of electricity production by fuel source in Australia and France in 1980 and 2000


 The given pie charts elucidate changes in the use of different fuels for electricity production in Australia and France between 1980 and 2000.

Overall, although in  the two decades, the dependence of both the countries shifted to a single fuel ,Australia was already using coal as a major fuel , while France used a mix of different sources in 1980.

Australia,in 1980,produced 100 units, majorly using coal, 50 units , followed by natural gas and hydro power, 20 units each and oil, 10 units. From 1980 to 2000, the production rose to 170, and coal became prominent, producing 130 units. Hydro power also rose to 36 units, but other fuels fell dramatically. 

However, France used a mix of fuels in 1980 and produced 90 units, producing 25 units each from coal and natural gas, 20 with oil, 15 with nuclear and 5 with hydro power. However, there was a major shift in 20 years with nuclear power producing 126 units out of 180 while others were used sparingly.