Search This Blog

Showing posts with label Ielts Academic Writing Task 1 - Graphs. Show all posts

Friday, December 29, 2023

The graph below shows the number of tourists visiting a particular Caribbean island between 2010 and 2017

 The graph below shows the number of tourists visiting a particular Caribbean island between 2010 and 2017. Summarize the information by selecting and reporting the main features, and make comparisons where relevant.

Write at least 150 words. 
The graph below shows the number of tourists visiting a particular Caribbean island between 2010 and 2017


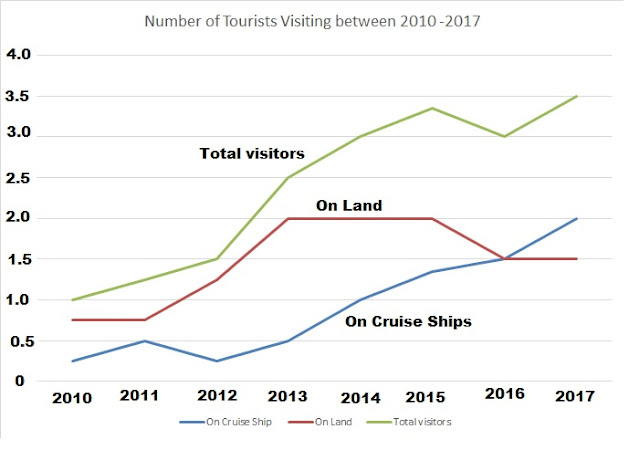
The graph elucidates the number of tourists visiting a Caribbean Island between the period of 2010 and 2017.

Overall, the visitors staying on cruise ships and the total number of visitors experienced similar trends. The former increased upto 2011, however, declined in 2012; they further increased up till 2017. Similarly, the total numbers of visitors rose upto 2015; the trend remained constant till 2016 and spiked in 2017.

In 2010, the visitors on ships were 0.5 million, but fell to approximately 0.25 in 2012. The numbers then experienced an upward trend till 2017 to 2 million. However, the those staying on the island remained constant till 2011 at almost 0.75; the numbers of increased upto  2013 to 2.0, but remained unchanged till 2015, and decreased up to 2016 to nearly 1.5 million. However, it climbed slightly to 1.5 up to 2017.

The total visitors went up over 3.0 million up to  2015; thereafter, after a dip till 2016, it witnessed a surge to 3.5.  

Tuesday, October 10, 2023

The Bar graph below shows the percentage of waste recyled by housholds of a city in the year 1992, 1997 and 2002. Summarise and compare where relevant.

The Bar graph below shows the percentage of waste recyled by housholds of a city in the  year 1992, 1997 and 2002. 
Summarise and compare where relevant. 
Write at least 150 words 

The Bar graph below shows the percentage of waste recyled by housholds


The supplied graph elucidates and compares the proportion of distinct categories of domestic refuse reprocessed in a city from 1992 to 2002.

At the outset, in 1992, cans were the highest recycled products with almost 13%, followed by plastic and paper with a negligible difference as compared to the former, and glass was the lowest. Nonetheless, from 1992 to 1997, glass increased to nearly 29%, whereas paper and plastic also registered an increment, reaching to around 18% and 11% respectively, but cans dipped to 11% approximately which was the least.

Similarly, between 1997 and 2002, recycling of the glass witnessed an exponential rise to almost 49%, followed by paper and the cans that climbed to  almost 29% and 21% respectively; however, the percentage of plastic recycled remained unchanged.

Overall, it is conspicuous that glass had accounted for an upward movement and paper also witnessed the similar pattern. Nevertheless, cans went through an oscillating trend, whereas the proportion of plastic reused was stable after an initial rise.


Tuesday, August 1, 2023

The graph below shows the number of shops that closed and the number of new shops that opened in one country between 2011 and 2018

The graph below shows the number of shops that closed and the number of new shops that opened in one country between 2011 and 2018. 

Summarize the information by selecting and reporting the main features, and make comparisons where relevant. 


The given line graph elucidates and compares the patterns of opening and closure of shops in a country between 2011 and 2018.      

In general, in 2011, approximately 8500 new outlets were established, but over the next year up to 2012 numbers slid down sharply to under 4000. From 2012-2014 there was an increment of more than 2000 shops being opened, the number reaching to over 6000. Moving further, there was a decline over the next four years; fewer stores were opened with the figures plummeting to 3000 by 2018, even though there was a stability for two years between 2015 and 2017 when both years saw yearly 4000 shops starting each year.

In continuation, although the number of stores shutting down experienced similar patterns, they overtook the figures of new openings. In 2011, almost 6200 shops  closed, and between 2011 and 2014 there was an ascent to 6400 following fluctuations. From 2014-2015 there was a notable dip to almost 700, but by 2018 it climbed back to over 5000.


Tuesday, September 13, 2022

Ielts Academic Writing Task 1 Ielts Graph below shows the number of shops that closed and the number of new shops that opened in one country between 2011-2018


The Graph below shows the number of shops that closed and the number of new shops that opened in one country between 2011-2018.

Summarize the Infomation by selecting and reporting the main features, and make comparisions where relevant. 

Write at least150 words.  


The given line graph elucidates and compares the patterns of opening and closure of shops in a country between 2011 and 2018.

In general, in 2011, approximately 8500 new outlets were established, but over the next year up to 2012 numbers slid down sharply to under 400. From 2012-2014 there was an increment of more than 2000 shops being opened, the number reaching to over 6000. Moving further, there was a decline over the next four years; fewer stores were opened with the figures plummeting to 3000 by 2018, even though there was a stability for two years between 2015 and 2017 when both years saw yearly 4000 shops starting each year.

In continuation, although the number of stores shutting down experienced similar patterns, they overtook the figures of new openings. In 2011, almost 6200 shops  closed, and between 2011 and 2014 there was an ascent to 6400 following fluctuations. From 2014-2015 there was a notable dip to almost 700, but by 2018 it climbed back to over 5000.


Thursday, April 7, 2022

Ielts Academic Writing Task 1 bar graph The Charts below show UK and USA energy consumption in 2000 and 2006. Summarize the information by selecting and reporting the main features, and make comparisons where relevant.


The Charts below show UK and USA energy consumption in 2000 and 2006. Summarize the information by selecting and reporting the main features, and make comparisons where relevant.

Summarize information by selecting and reporting the main features, and make comparisons where relevant.

Write at least 150 words. 

The Charts below show UK and USA energy consumption in 2000 and 2006


The given bar graphs illustrate changes in use of various energy sources in the UK and USA from 2000-2006.

Overall, while in the UK the reliance shifted from coal to gas, the dependence of the USA on oil increased. However, both the countries reduced their dependence on coal.

In the UK, coal accounted for 30% in 2000. This was followed by oil (approximately 27%), gas (nearly 17%), nuclear power (15%) and other renewable resources (almost 9%). From 2000 to 2006, there was a shift from coal to gas as it became a major source, contributing nearly 37%. The use of oil also rose to 30% and other renewable resources to 10%, whereas coal dropped dramatically to around 7%.

Nevertheless, in the USA, oil remained the main stay and instead increased from almost 37 to 40%. Similarly, gas also witnessed an increment from 15%-25%. But, coal plummeted from 35% to just above 25%. Similarly, nuclear power and other renewable resources also dropped from nearly 7% and 5% respectively to around 5%.

Friday, March 25, 2022

Ielts Academic Writing Task 1 bar graph The given bar graph elucidates and compares the concentration of global wealth and population

The Chart below gives information about global population percentages and distribution of wealth by region.

Summarize the information by selecting and reporting the main features, make comparisons where relevant.

Write at least 150 words


The given bar graph elucidates and compares the concentration of global wealth and population in different regions and countries of the world. 

Quite strikingly, the regions, like North America, Europe and Rich Asia Pacific, that hold most wealth have negligible population, while regions like China, Other Asia Pacific, India, Africa and Latin America and Carribean have higher ratio of populations but least wealth. 

North America is the most affluent region with almost 34% of global financial resources, followed by Europe, 30% and Rich Asia Pacific, 24%, whereas the percentage of global populace in these regions is negligible, around 5%, except Europe which houses 15% inhabitants of the world. 

However, other parts of the world have a higher population ratio in contrast to the insignificant amount of wealth. China has 27% of global populace, followed by Other Asic pacific and India with nearly 17% each, Africa, 10% and Latin America and Carribean, 7% approximately. But, the amount of monetary resources in each of these regions is below 5%.


Friday, November 19, 2021

The chart Below shows the results of a survey about people's coffee and tea buying and drinking habits in five Australian cities Ielts Academic Writisg Task 1

The chart Below shows the results of a survey about people's coffee and tea buying and drinking habits in five Australian cities.

Summarize the information by selecting and reporting the main features, and make comparisons where relevant.

Write at least 150 words


The chart Below shows the results of a survey about people's coffee and tea buying and drinking habits in five Australian cities


The given chart elucidates outcomes of a survey regarding the patterns of people drinking and consuming coffee and tea in five Australian cities over the last 4 weeks.

Overall, most visited a cafe in all cities except Adelaide with the highest numbers confirming in Melbourne and Hobart, while when in case of buying instant coffee, Brisbane reported highest ratios, and highest percentage bought fresh coffee in Sydney.


Most visited a cafe for a tea or coffee, with Hobart and Melbourne leading with nearly 64%. This was followed by Sydney, almost 61%, Brisbane, 55, and Adelaide, just under 50%.

Moving further, instant coffee was bought by consumers in Hobart, nearly 55%, followed by Brisbane, 53%, Adelaide, 50% - it ranked slightly higher than visitors to cafes, Melbourne and Sydney with approximately 47% and 45% respectively.  

Similarly, the ratio of those buying fresh coffee ranked lowest, Sydney had the highest takers with 43%, closely followed with Melbourne, 43%. Hobart reported nearly 38% and Adelaide and Brisbane had almost 35% each. 

Wednesday, March 17, 2021

Ielts Academic Writing Task 1 The charts below compare five different countries


The charts below compare five different countries, showing the electricity used (measured in megawatts or mw) in a typical hospital during one week, and  also the number of emergency calls made by local residents during the same week. The last charts shows the average time (in minutes) spent on assessing emergency cases by hospitals medical staff before the patients are treated.

Write a report summarizing the information. Select and describe the main features, and make comparisons where relevant.

Write at least 150 words


The charts below compare five different countries


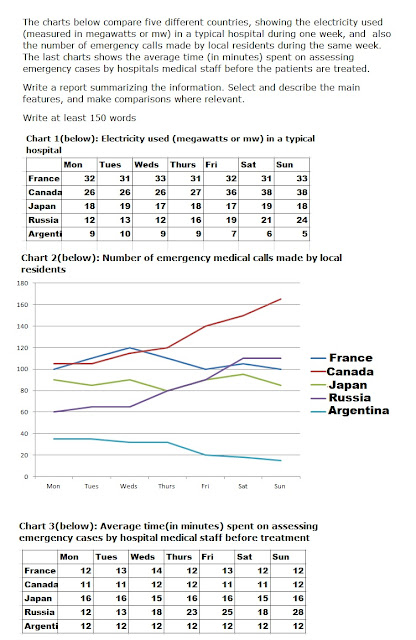
The given tables and graph elucidate the consumption of electricity(in megawatts), calls made by locals and average time taken to assess medical emergency cases by hospitals in 5 countries in a week. 

Overall, the patterns in terms of energy consumption, and number of emergency medical calls show identical patterns in different countries, except the average time taken to pre-assess emergency cases. 

In terms of energy consumption and calls,  France and Japan depict similar trends with limited fluctuations, between 12-14 and 15-16, and 100-120 and 80-90 respectively, while  in Canada and Russia, both energy tend to rise, from 26-38 and 12-24, and over 100 - over 160 and 60-110 respectively, whereas, Argentina experiences lowest incidence in both which also declines from 9 to 5 towards weekend.   

However, when it comes to the average time spent to assess emergencies before treatment, France, Canada, Japan do not witness much change, ranging between 11-16 minutes; in Argentina it stays constant at 12 minutes, but Russia experiences a rise from 12-28 minutes over the week.  


Sunday, February 7, 2021

Ielts Academic Writing Task 1 Graph The table below shows the figures for imprisonment the five countries between 1930 and 1980


The table below shows the figures for imprisonment the five countries between 1930 and 1980.

Write a report for a university professor, lecturer describing the information shown below

Write at least 150 words


The given bar chart elucidates the trends of imprisonments in five countries, between 1930-1980. 

Overall, while the number of prisoners in the UK rose consistently in five decades, the other four countries witnessed fluctuation in numbers. Similarly, while Canada had the highest number of prisoners in 1930, the US surpassed all other nations in the given period, and had the highest number of convicts in 1980. 

The number of prison sentences in the UK rose consistently from approximately 30,000 to over 80,000 from 1930-80. In contrast, Canada had 120000 prisoners in 1930, it fell upto 1980 touching nearly 90,000, but not without fluctuations. New Zealand and Australia saw similar trends, plummeting from 100 and 70 in 1930 respectively to approximately 45 and 42 in 1950 saw a rise to over 80 while the latter fell further to 50. The number of respectively, rising back to over 60 in 1970. In the next decade, the former convicts in the US touched almost 140.