Search This Blog

Showing posts with label IELTS Writing Task 1 Graphs. Show all posts

Wednesday, May 18, 2022

Ielts Academic Writing Task 1 Ielts Graph The chart below gives information about Southland’s main exports in 2000, 2022 and future projections for 2025


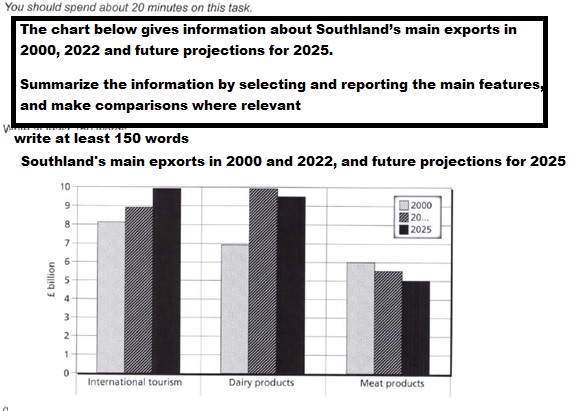
The chart below gives information about Southland’s main exports in 2000, 2022 and future projections for 2025.

Summarize the information by selecting and reporting the main features, and make comparisons where relevant  

The chart below gives information about Southland’s main exports in 2000, 2022 and future projections for 2025


The given bar graph elucidates and compares changes in exports of three items from Scotland from 2000-2022 and presents forecasts for 2025. The quantum of exports is calibrated in billion pounds.  

To start with, in 2000, international tourism helped gross just over 8 billion pounds, while dairy products fetched 7 billion pounds. The exports of meat products stood at 6 billion pounds.

From 2000 to 2020, there was an increment in the earnings of international tourism from 8 to almost 9 billion pounds, and even though dairy products also registered a rise, it was quite steep as it climbed to nearly 10 billion pounds. In contrast, meat products   witnessed a fall from 6 to about 5.5 billion pounds. 

Moving further, the predictions for 2025 show that international tourism would continue to ascend and reach approximately 10 billion pounds, whereas dairy products are expected to plummet to near about 9.5 billion pounds. Meat products will continue to slide down further to 5 billion pounds.  


Friday, December 18, 2020

Ielts Academic Writing Test Bar Graph The bar chart below shows the percentage of Australian men and women in different age groups who did regular physical activity in 2010


The bar chart below shows the percentage of Australian men and  women in different age groups who did regular physical activity in 2010.

Summarize the information by selecting and reporting the main features, and make comparisons where relevant.  

The bar chart below shows the percentage of Australian men and  women in different age groups who did regular physical activity in 2010


The given bar chart illustrates the participation of Australian men and women in regular physical regimes in different age groups, in 2010. 


Overall, age-wise patterns of both the genders were inversely proportional to each other, where lesser men undertook such activities as the age rose to a certain point, participation of women rose, but in 65 and over, both the genders had equal engagement. Similarly, the highest participation in males was in the youngest age group while among women it was at the peak in the oldest.


The highest participation among men was age group 15 to 24, 52.8%, but it plummeted  to 39.5% in 35 - 44 group though the fall was steeper upto 25-34, reaching 42.2%. After that the participation rose steadily to 46.7% in the oldest group. 


However, the participation among women peaked at 53.3% in the 45 - 54 age group after rising from 47.7%, the lowest, among the youngest group, it dropped to 47.1% in the oldest group.


Friday, June 19, 2020

The bar chart below gives information about the percentage of the population living in urban areas in the world and in the parts of the world. Summarise the information by selection the main features, and make comparisons where relevant. Write at least 150 words. ~ by Sanchit


The bar chart below gives information about the percentage of the population living in urban areas
Ielts Academic Writing Task 1 - Graphs 
The given graph illustrates the percentage of the population residing in metropolitan areas around the globe and in various parts of the world from 1950 to 2050.
Overall, Europe, Latin America and North America experienced a tremendous urbanisation compared to the whole world, while Africa and Asia elucidate rates that are lower than global average.
In 1950 North America led with 64% populace residing in cities, compared to 29% of the world, following it were Europe, 51%, and Latin America, 42%. Similar trends continued until 2015 and in predictions of 2050, except that after 2015, Latin America will overtake Europe, and is expected to house 84% populace in urban locations in 2050 as compared to 78% of the latter.
However, Africa and Asia experienced a slower rise in urban population, which was well below the world average, with 15% and 17% respectively in 1950 compared to world ratio, 29%; 37% and 41% in 2015 respectively as against 49% global, and are expected to stay lower than global average until 2050. 

Tuesday, June 26, 2018

Ielts Academic Writing Task 1 Below is graph showing the incidence


Below is graph showing the incidence of mental illness ( as indicated by receipt of incapacity Benefit) amongst older UK males, from 1971-2015. The reform in the benefits system took place in 1995. 
Below is graph showing the incidence of mental illness
Ielts Academic Writing Task 1

The given graph elucidates and compares the changes in mental illness, from 1970 to 1995 and after the incapacity benefit reforms introduced in 1995 till 2015.
Overall, observed that reforms brought about a  big decline in incapacity grants after the reforms were affected.
Prior to the reforms, there was a significant rise in incapacity benefit payouts between 1970 and 1995 in all age groups even though the problems seemed to be prominent in the 60-64 age group, rising from approximately 12% to nearly 28% in 1995. The other two age groups also witnessed a rise, from 7% to 18% in 65-69 years and 3% to 55-59 years.
Post reforms, the situation improved dramatically, there was an overall decline in the benefit payouts. The payouts plummeted steeply in 65-69 age group fell from 20% to less than 5%, but in other age groups the decline was not so significant. The fall in the 55-59 group was steady fell by 7%, while in age group the fall was about 10%  


Sunday, May 27, 2018

Ielts Academic Writing task 1 Bar Graphs The chart below shows the total number of minutes (in billions) of telephone calls in the UK


The chart below shows the total number of minutes (in billions) of telephone calls in the UK, divided into three categories, from 1995 – 2002.
Summarize the information by selecting and reporting the main features, and make comparisons where relevant.
Write at least 150 words


The given bar chart elucidate and compares the data about minutes ( in billions) logged on three types of calls in the UK between 1995 and 2002.

Overall, it can be observed that even though the local calls made  from fixed line rose and fell, they still remained the highest, while long distance and mobile call minutes registered a contrasting rise through the similar period.

Fixed line local calls registered a rise from 70 billion minutes to 90 million minutes between 1995 and 1999, but fell back to 70 billion minutes from 1999 to 2004.

In contrast, the calls made to other parts of the country and overseas and mobile  registered a rise in the similar period though while the the number minutes on domestic and foreign calls remained ascended steadily, rise in number of mobile phone call minutes was negligible from 1995 to 1998, and after 1998 the number of minutes started rising significantly, rising dramatically nearly four-folds in a matter of next three years reaching 40 billion minutes.